Other: Intermediate State of tables during refresh jobs.
Completed
Hi Team
We would like to have a feature where during the Refresh job, we need to know the status of the tables. Whether they have been replicated to the destination. We only see BUSY status during the whole RUN of Refresh job. We are not able to ascertain if a particular table/view has been refreshed to the destination. We are talking about times when our job has 100 of tables to refresh and it takes around 30 hours to refresh. During these 30 hours we only see table state of all 100 tables as BUSY. We need to know the intermediate states of the tables.
Refer Ticket: 279106
-
Official comment

Hi Nitin and Ranjeet,
I am pleased to let you know that we have added functionality to the Fivetran dashboard that addresses your request for more real-time information while syncs are running.
For a historical or initial sync, you can view table level progress from the connection status page.
https://fivetran.com/docs/changelog/2025/november-2025#tablelevelsyncdetails
-

Hi Nitin,
There are two ways you can see progress during the run:
- The refresh job log is updated as the job progresses. The log even provides partial updates on tables. However, the information is interleaved for any parallel processes you may be running which makes this a sub-optimal way to identify progress.
Here are some log records (note the timestamp at the beginning of the line):2025-07-03T20:51:12-07:00: o19_snow_int-refr-oracle_dck-snow_int: Refreshed 'new_order' from location 'oracle_dck' to location 'snow_int' (8534 rows 69 wide compression=99.8%). This bulk refresh took 22.065264s.2025-07-03T20:51:12-07:00: o19_snow_int-refr-oracle_dck-snow_int: Event status: 73(+4)/169 subtasks done(+busy)/total.2025-07-03T20:51:12-07:00: o19_snow_int-refr-oracle_dck-snow_int: Refreshed 'customer' from location 'oracle_dck' to location 'snow_int' (30000 rows 861 wide compression=31.9%). This bulk refresh took 22.924758s.2025-07-03T20:51:12-07:00: o19_snow_int-refr-oracle_dck-snow_int: Refreshed 'history' from location 'oracle_dck' to location 'snow_int' (42858 rows 173 wide compression=86.3%). This bulk refresh took 22.598718s.2025-07-03T20:51:14-07:00: o19_snow_int-refr-oracle_dck-snow_int: Refreshed 'item' from location 'oracle_dck' to location 'snow_int' (100000 rows 149 wide compression=45.3%). This bulk refresh took 24.643813s.2025-07-03T20:51:14-07:00: o19_snow_int-refr-oracle_dck-snow_int: Event status: 91(+4)/169 subtasks done(+busy)/total.2025-07-03T20:51:19-07:00: o19_snow_int-refr-oracle_dck-snow_int: Refreshed 'orders' from location 'oracle_dck' to location 'snow_int' (42905 rows 169 wide compression=94.1%). This bulk refresh took 28.994185s.2025-07-03T20:51:19-07:00: o19_snow_int-refr-oracle_dck-snow_int: Event status: 97(+4)/169 subtasks done(+busy)/total.
- Use the refresh even view. I verified that both HVR 6.1 and 6.2 show the progress there. Below is a screenshot of an ongoing refresh event on 6.1.0/80. Note that some of the tables show they are done, and others are still busy.
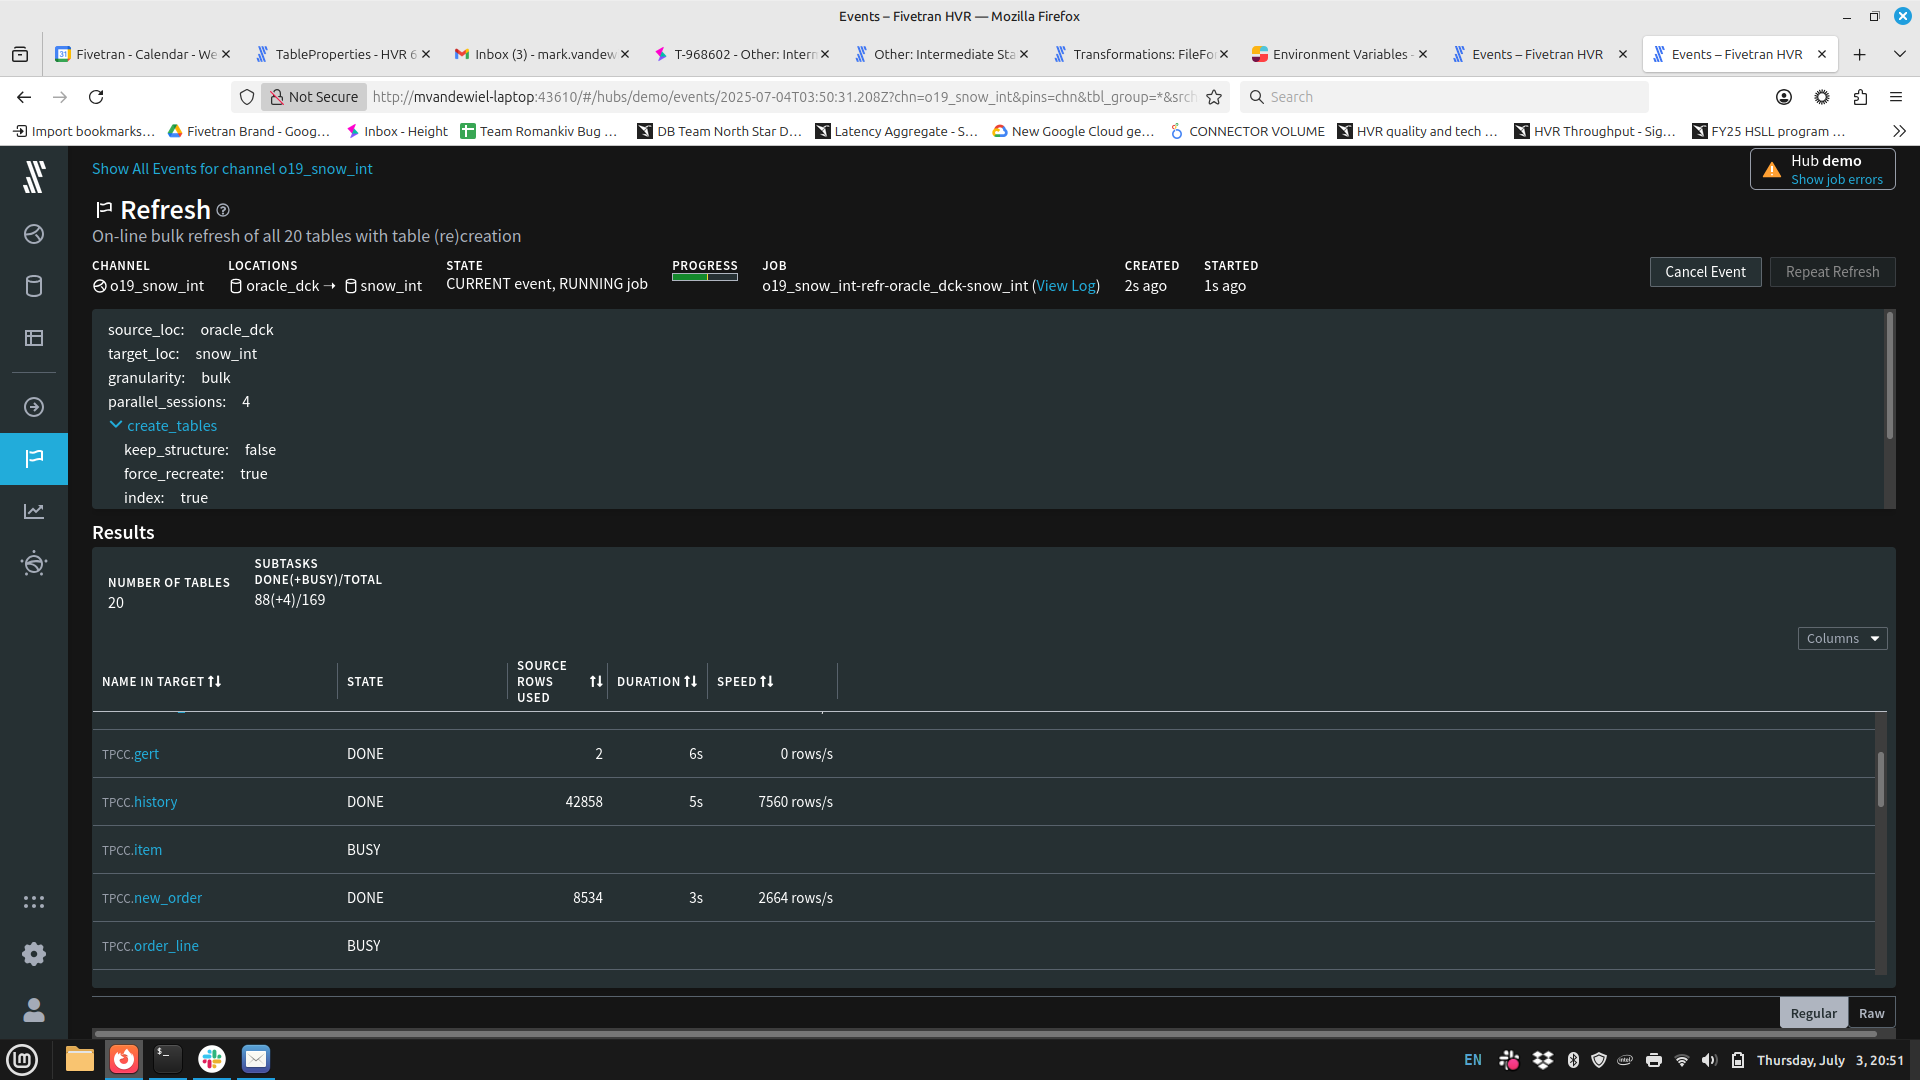
I would expect you see the same in your interface. Please let me know.
Thank you,
Mark. - The refresh job log is updated as the job progresses. The log even provides partial updates on tables. However, the information is interleaved for any parallel processes you may be running which makes this a sub-optimal way to identify progress.
-

In fivetran portal (non HVR), there is no options to see the table stats. In HVR, we can see more accurate / better information on which tables are in progress/rows replicated on the HVR portal. In the Fivetran portal, some features are missing. Is it something being planned?
We would like to see the per-table replication status during the extract/process/load steps. Currently, the extract/process/load steps of replication are black boxes, and you only see the final green or red status for success and error, with no intermediate view. Even the log that gets forwarded to the destination via Fivetran meta is the final result. It would be good to give a more real-time intermediate view during the replication step.
Please sign in to leave a comment.
Comments
3 comments