Other: Improve HVR statistics
Answered
HVR statistics (integrated changes, latency) are displaying inaccurate values. Depending on the graph range, if set to 10m, you'll either get the accurate latency values or no values at all.
-

Hi Christian,
What do you mean when you say "inaccurate values"?
Please note that HVR presents a time series chart. I.e. we report a value for a time window. For many metrics like change counts or latency this is has to be an aggregate e.g. sum or min/max.
As it relates to access to metrics at different levels of granularity: by default HVR purges statistics based on Statistics_Retention_Policy (https://fivetran.com/docs/hvr6/property-reference/hub-properties). Once statistics have been purged at a low level of granularity naturally you can no longer retrieve them. We like to purge regularly to keep the repository database size manageable. But of course you can adjust purging depending on your level of comfort with a massive hvr_stats table in your repository database.
We have an option to send the statistics to a secondary location with Statistics_Second_Location (same link as above). This option allows you to send statistics to an alternative location e.g. your data warehouse and keep statistics as long as you want.
Thanks,
Mark. -
Hi Mark,
Good Day!
What I mean is that when the graph range is set at 10m, latency values for each job is usually blank.
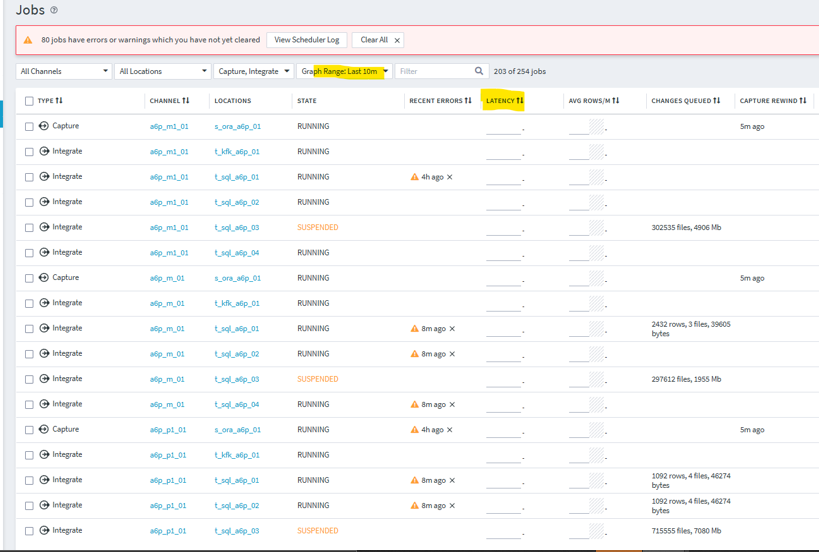
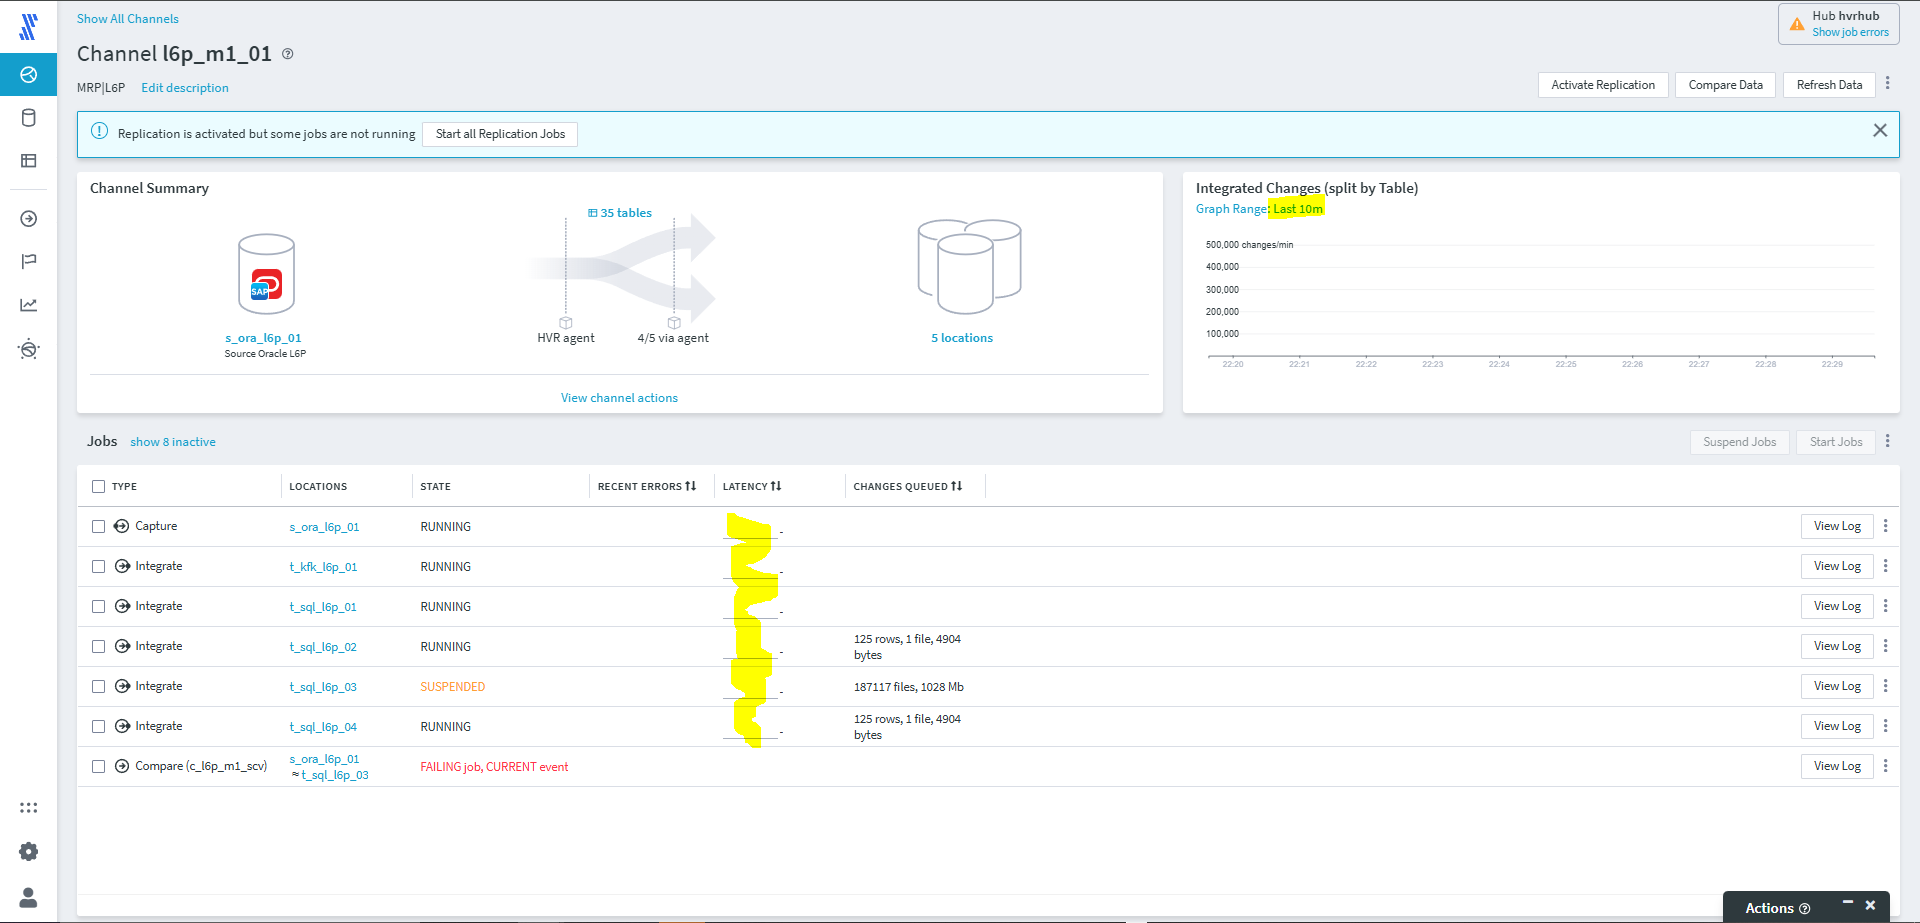
We were only able to make latency values appear when set to 6h but they do not represent the current latencies: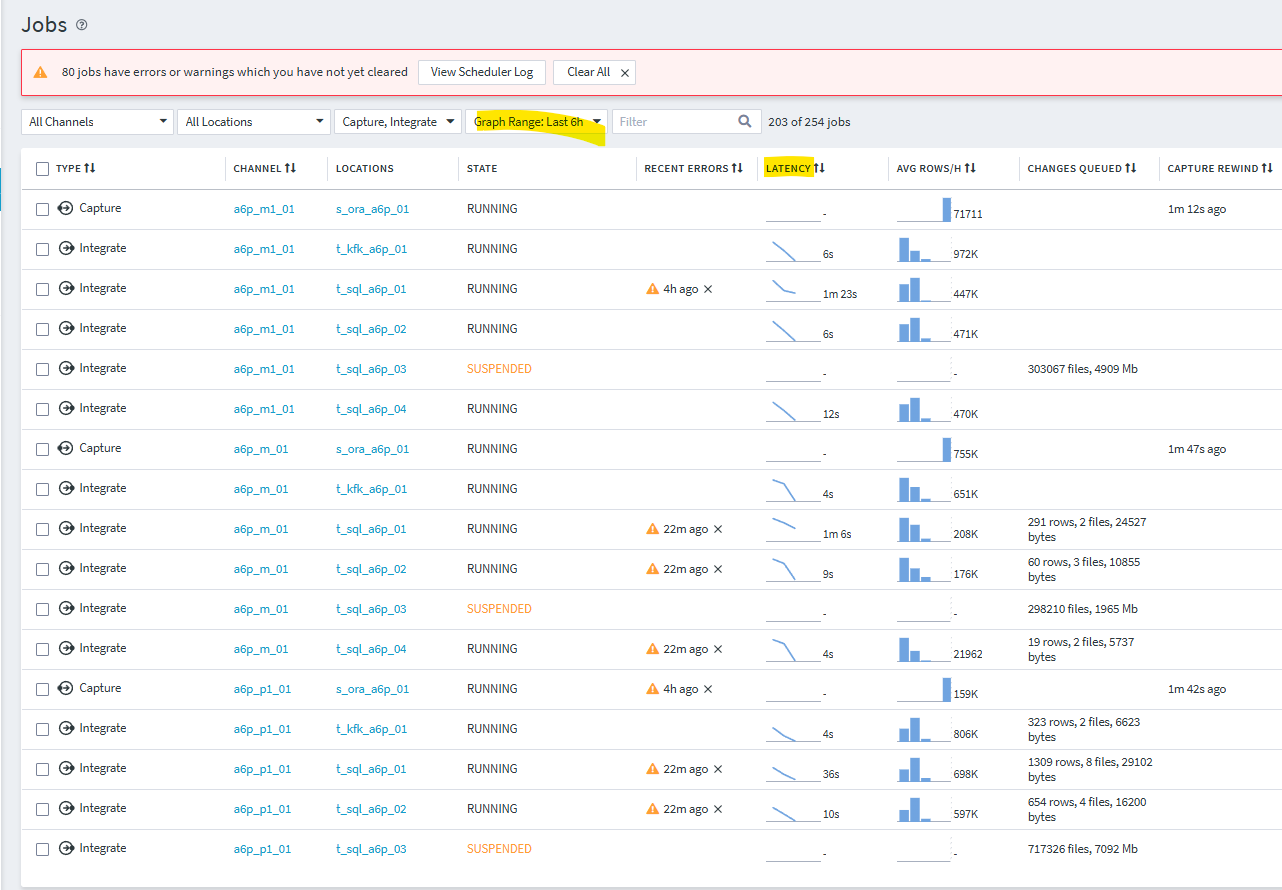
This is an important information for the business to have in a timely manner thus manually viewing the logs for each job to identify the current latencies is not ideal.
-
Hi Christian,
It sounds to me that what you are looking for in all cases is current latency. HVR however presents the worst latency over the time period that you have selected.
Is this a correct description of what you are looking for?
Thanks,
Mark. -
Hi Mark,
It is clear that hvr presents the worst latency over the time period selected. The issue we have is that when we set it at 10m which we expect should give us a pretty good indication of current latencies, it only shows blanks.
Please sign in to leave a comment.
Comments
4 comments